Architect Job Trends in the UK excluding London

Architect
UK > UK excluding London

The median Architect salary in the UK excluding London is £80,000 per year, according to job vacancies posted during the 6 months leading to 18 November 2025.

The table below compares current salary benchmarking and summary statistics with the previous two years.

6 months to
18 Nov 2025
Same period 2024 Same period 2023
Rank 71 32 33
Rank change year-on-year -39 +1 +26
Permanent jobs requiring an Architect 1,269 2,531 2,023
As % of all permanent jobs in the UK excluding London 3.48% 5.36% 6.65%
As % of the Job Titles category 3.87% 5.68% 6.95%
Number of salaries quoted 781 1,540 1,074
10th Percentile £60,000 £55,000 £56,325
25th Percentile £68,500 £66,250 £65,031
Median annual salary (50th Percentile) £80,000 £75,150 £76,000
Median % change year-on-year +6.45% -1.12% -3.18%
75th Percentile £90,000 £87,500 £87,314
90th Percentile £98,750 £97,500 £97,212
UK median annual salary £82,500 £80,000 £85,000
% change year-on-year +3.13% -5.88% -

All Permanent IT Job Vacancies
UK excluding London

For comparison with the information above, the following table provides summary statistics for all permanent IT job vacancies in the UK excluding London. Most job vacancies include a discernible job title that can be normalized. As such, the figures in the second row provide an indication of the number of permanent jobs in our overall sample.

Permanent vacancies in the UK excluding London with a recognized job title 32,762 44,543 29,093
% of permanent jobs with a recognized job title 89.88% 94.37% 95.70%
Number of salaries quoted 20,475 23,810 21,893
10th Percentile £27,250 £30,000 £28,000
25th Percentile £32,500 £40,000 £37,500
Median annual salary (50th Percentile) £47,500 £51,197 £52,500
Median % change year-on-year -7.22% -2.48% -
75th Percentile £65,000 £67,500 £67,500
90th Percentile £80,000 £80,000 £80,000
UK median annual salary £52,500 £57,500 £60,000
% change year-on-year -8.70% -4.17% -

Architect
Job Vacancy Trend in the UK excluding London

Historical trend showing the proportion of permanent IT job postings featuring 'Architect' in the job title relative to all permanent IT jobs advertised in the UK excluding London.
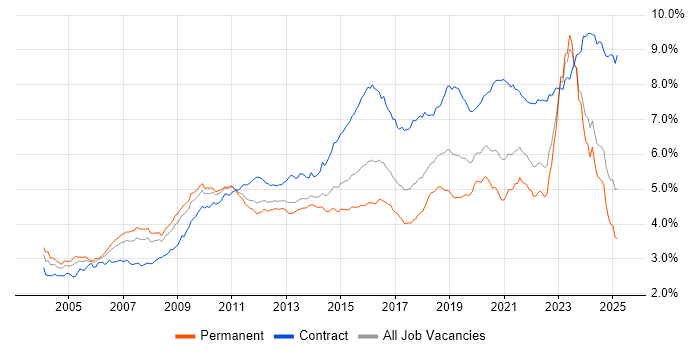
Architect job vacancy trend in the UK excluding London

Architect
Salary Trend in the UK excluding London

Salary distribution trend for Architect job vacancies in the UK excluding London.

Salary distribution trend for Architect job vacancies in the UK excluding London

Architect
Salary Histogram in the UK excluding London

Salary distribution for jobs citing Architect in the UK excluding London over the 6 months to 18 November 2025.

Salary histogram for Architect in the UK excluding London

Architect
Job Locations in the UK excluding London

The table below looks at the demand and provides a guide to the median salaries quoted in IT jobs citing Architect within the UK excluding London region over the 6 months to 18 November 2025. The 'Rank Change' column provides an indication of the change in demand within each location based on the same 6 month period last year.

Location Rank Change
on Same Period
Last Year
Matching
Permanent
IT Job Ads
Median Salary
Past 6 Months
Median Salary
% Change
on Same Period
Last Year
Live
Jobs
South East -31 362 £77,500 - 368
North of England -40 299 £79,500 +6.00% 176
Midlands -10 240 £80,000 +6.67% 132
South West -20 151 £80,000 +6.67% 123
North West -41 151 £80,000 +6.67% 113
West Midlands -14 150 £77,000 -0.65% 92
Yorkshire -26 105 £80,000 +3.23% 54
East of England -30 91 £90,000 +5.88% 70
East Midlands 0 87 £80,000 +14.29% 38
Scotland -53 70 £80,000 +3.13% 56
North East -16 42 £75,000 -0.53% 9
Wales -12 33 £75,000 +36.36% 14
Northern Ireland 0 29 £75,000 -6.25% 14
Architect
UK

Architect Skill Set
Top 30 Co-Occurring Skills & Capabilities in the UK excluding London

For the 6 months to 18 November 2025, Architect job roles required the following skills and capabilities in order of popularity. The figures indicate the absolute number of co-occurrences and as a proportion of all permanent job ads across the UK excluding London region featuring Architect in the job title.

1 358 (28.21%) Azure
2 240 (18.91%) Security Cleared
3 220 (17.34%) AWS
4 208 (16.39%) Agile
5 204 (16.08%) Roadmaps
6 203 (16.00%) Microsoft
7 194 (15.29%) Enterprise Architecture
8 174 (13.71%) Continuous Improvement
9 166 (13.08%) TOGAF
10 161 (12.69%) Mentoring
11 149 (11.74%) DevOps
12 147 (11.58%) Analytics
13 141 (11.11%) Problem-Solving
14 140 (11.03%) SC Cleared
15 138 (10.87%) Data Modelling
16 129 (10.17%) Python
17 127 (10.01%) AI
18 126 (9.93%) Degree
19 122 (9.61%) DV Cleared
20 121 (9.54%) GCP
21 115 (9.06%) Data Architecture
22 113 (8.90%) Stakeholder Management
23 99 (7.80%) Business Strategy
24 97 (7.64%) Technical Leadership
25 95 (7.49%) SAP
26 94 (7.41%) Project Management
27 93 (7.33%) Decision-Making
27 93 (7.33%) SaaS
28 92 (7.25%) Architectural Design
29 91 (7.17%) Microservices

Architect Skill Set
Co-Occurring Skills & Capabilities in the UK excluding London by Category

The following tables expand on the one above by listing co-occurrences grouped by category. They cover the same employment type, locality and period, with up to 20 co-occurrences shown in each category:

Application Platforms
1 17 (1.34%) CMS
2 13 (1.02%) Apache Airflow
3 11 (0.87%) Appian
4 10 (0.79%) SharePoint
5 8 (0.63%) Apache Spark
6 6 (0.47%) Apache
7 5 (0.39%) Confluence
8 3 (0.24%) Microsoft Exchange
9 2 (0.16%) nginx
10 1 (0.079%) ArcGIS
10 1 (0.079%) Cloud Foundry
10 1 (0.079%) JBoss
10 1 (0.079%) Oracle SOA Suite
10 1 (0.079%) SAS
Applications
1 5 (0.39%) Chatbot
2 1 (0.079%) Oracle Smart View
2 1 (0.079%) Simulink
Business Applications
1 63 (4.96%) SAP S/4HANA
2 49 (3.86%) SAP MDG
3 37 (2.92%) OpenText VIM for SAP
4 16 (1.26%) Dynamics CRM
5 11 (0.87%) Oracle ERP
6 5 (0.39%) Shopify
7 3 (0.24%) NetSuite
7 3 (0.24%) Oracle General Ledger
7 3 (0.24%) Oracle Payables
7 3 (0.24%) Oracle Receivables
8 2 (0.16%) Dynamics GP
8 2 (0.16%) Maximo
8 2 (0.16%) Oracle Assets
8 2 (0.16%) SAP FI
8 2 (0.16%) Sparx Enterprise Architect
9 1 (0.079%) Oracle Applications
9 1 (0.079%) Oracle EBS
9 1 (0.079%) SAP CO
9 1 (0.079%) SAP FI/CO
9 1 (0.079%) SAP MM
Cloud Services
1 358 (28.21%) Azure
2 220 (17.34%) AWS
3 121 (9.54%) GCP
4 93 (7.33%) SaaS
5 57 (4.49%) PaaS
6 46 (3.62%) IaaS
7 45 (3.55%) Dynamics 365
8 43 (3.39%) Power Platform
9 41 (3.23%) Snowflake
10 36 (2.84%) Microsoft 365
10 36 (2.84%) OCI
11 32 (2.52%) Serverless
12 26 (2.05%) Azure DevOps
13 17 (1.34%) Amazon S3
14 14 (1.10%) GitHub
15 12 (0.95%) Azure Data Factory
15 12 (0.95%) Azure Stack
16 11 (0.87%) MinIO
17 10 (0.79%) Entra ID
18 9 (0.71%) iPaaS
Communications & Networking
1 32 (2.52%) LAN
2 30 (2.36%) VPN
2 30 (2.36%) WAN
3 28 (2.21%) Firewall
4 24 (1.89%) Network Security
5 17 (1.34%) Broadband
6 15 (1.18%) Wi-Fi
7 13 (1.02%) Junos
8 6 (0.47%) BGP
9 5 (0.39%) SSL
9 5 (0.39%) VoIP
10 4 (0.32%) ATM
10 4 (0.32%) Cisco Nexus
10 4 (0.32%) DNS
10 4 (0.32%) Ethernet
10 4 (0.32%) Frame Relay
10 4 (0.32%) OSPF
10 4 (0.32%) SAN
10 4 (0.32%) SDH
10 4 (0.32%) Software-Defined Networking
Database & Business Intelligence
1 76 (5.99%) Data Warehouse
2 31 (2.44%) Metadata
3 22 (1.73%) BigQuery
4 21 (1.65%) NoSQL
5 17 (1.34%) SQL Server
6 13 (1.02%) Power BI
7 7 (0.55%) Data Lake
7 7 (0.55%) Elasticsearch
7 7 (0.55%) Oracle BI Publisher
8 6 (0.47%) Airbyte
8 6 (0.47%) Delta Lake
8 6 (0.47%) Geospatial Data
8 6 (0.47%) Metadata Repository
8 6 (0.47%) MongoDB
9 5 (0.39%) Big Data
9 5 (0.39%) Data Vault
9 5 (0.39%) Oracle Database
9 5 (0.39%) PostgreSQL
10 4 (0.32%) Azure SQL Database
10 4 (0.32%) Relational Database
Development Applications
1 23 (1.81%) Jenkins
2 21 (1.65%) GitLab
3 15 (1.18%) SonarQube
4 11 (0.87%) Robot Framework
4 11 (0.87%) Selenium
4 11 (0.87%) Snyk
5 9 (0.71%) JIRA
5 9 (0.71%) MSI
5 9 (0.71%) Octopus Deploy
6 8 (0.63%) Git
7 6 (0.47%) MSBuild
7 6 (0.47%) Team Foundation Server
7 6 (0.47%) Visual Studio
8 1 (0.079%) Bitbucket
8 1 (0.079%) ERwin
8 1 (0.079%) Sonatype Nexus
General
1 315 (24.82%) Social Skills
2 157 (12.37%) Finance
3 151 (11.90%) Analytical Skills
4 92 (7.25%) Public Sector
5 85 (6.70%) Marketing
6 73 (5.75%) Law
7 53 (4.18%) Inclusion and Diversity
8 43 (3.39%) Presentation Skills
9 41 (3.23%) Legal
10 28 (2.21%) Manufacturing
11 24 (1.89%) Retail
12 22 (1.73%) Banking
12 22 (1.73%) Influencing Skills
13 17 (1.34%) Games
14 14 (1.10%) Documentation Skills
15 13 (1.02%) Electronics
16 10 (0.79%) Financial Institution
16 10 (0.79%) Organisational Skills
16 10 (0.79%) Publishing
17 9 (0.71%) Telecoms
Libraries, Frameworks & Software Standards
1 32 (2.52%) .NET
1 32 (2.52%) REST
2 30 (2.36%) Middleware
3 27 (2.13%) Kafka
3 27 (2.13%) React
4 26 (2.05%) Node.js
5 24 (1.89%) Django
6 20 (1.58%) SOAP
7 19 (1.50%) Oracle Fusion
8 18 (1.42%) Lightning Web Components
9 15 (1.18%) Visualforce
10 11 (0.87%) Apache NiFi
10 11 (0.87%) Web Services
11 10 (0.79%) gRPC
12 9 (0.71%) EDI
12 9 (0.71%) XML
13 8 (0.63%) CSS
13 8 (0.63%) GraphQL
13 8 (0.63%) HTML
14 7 (0.55%) ASP.NET
Miscellaneous
1 86 (6.78%) Cloud Native
2 36 (2.84%) Enterprise Software
3 35 (2.76%) Data Centre
4 33 (2.60%) Legacy Systems
5 29 (2.29%) Product Ownership
6 26 (2.05%) Management Information System
7 25 (1.97%) Self-Motivation
7 25 (1.97%) Virtual Team
8 21 (1.65%) Public Cloud
9 16 (1.26%) Greenfield Project
10 13 (1.02%) Hybrid Cloud
10 13 (1.02%) Low-Code
11 12 (0.95%) Private Cloud
12 11 (0.87%) AI Agents
12 11 (0.87%) Distributed Systems
12 11 (0.87%) IoT
13 9 (0.71%) PKI
14 8 (0.63%) Operational Technology
15 7 (0.55%) Reference Data
16 6 (0.47%) Onboarding
Operating Systems
1 23 (1.81%) Windows
2 19 (1.50%) Linux
3 4 (0.32%) AIX
4 3 (0.24%) Android
4 3 (0.24%) Windows Server
5 2 (0.16%) Unix
6 1 (0.079%) Embedded Linux
6 1 (0.079%) OpenVMS
6 1 (0.079%) OpenWrt
6 1 (0.079%) Red Hat Enterprise Linux
6 1 (0.079%) VMS
6 1 (0.079%) Windows 7
Processes & Methodologies
1 208 (16.39%) Agile
2 204 (16.08%) Roadmaps
3 194 (15.29%) Enterprise Architecture
4 174 (13.71%) Continuous Improvement
5 166 (13.08%) TOGAF
6 161 (12.69%) Mentoring
7 149 (11.74%) DevOps
8 147 (11.58%) Analytics
9 141 (11.11%) Problem-Solving
10 138 (10.87%) Data Modelling
11 127 (10.01%) AI
12 115 (9.06%) Data Architecture
13 113 (8.90%) Stakeholder Management
14 99 (7.80%) Business Strategy
15 97 (7.64%) Technical Leadership
16 94 (7.41%) Project Management
17 93 (7.33%) Decision-Making
18 92 (7.25%) Architectural Design
19 91 (7.17%) Microservices
20 88 (6.93%) Cybersecurity
Programming Languages
1 129 (10.17%) Python
2 71 (5.59%) C#
3 62 (4.89%) Java
4 60 (4.73%) SQL
5 24 (1.89%) JavaScript
6 23 (1.81%) C++
6 23 (1.81%) Go
7 18 (1.42%) Apex Code
8 17 (1.34%) PowerShell
8 17 (1.34%) SOQL
8 17 (1.34%) TypeScript
9 15 (1.18%) SOSL
10 10 (0.79%) Bicep
11 9 (0.71%) PHP
12 4 (0.32%) Bash
13 3 (0.24%) ABAP
13 3 (0.24%) C
13 3 (0.24%) R
13 3 (0.24%) T-SQL
14 2 (0.16%) PL/SQL
Qualifications
1 240 (18.91%) Security Cleared
2 140 (11.03%) SC Cleared
3 126 (9.93%) Degree
4 122 (9.61%) DV Cleared
5 75 (5.91%) TOGAF Certification
6 62 (4.89%) Computer Science Degree
7 47 (3.70%) AWS Certification
8 42 (3.31%) Azure Certification
9 41 (3.23%) BPSS Clearance
9 41 (3.23%) CISSP
10 39 (3.07%) AWS Certified Solutions Architect
11 34 (2.68%) CISM
12 31 (2.44%) Cisco Certification
13 26 (2.05%) Chartered Engineer
13 26 (2.05%) Microsoft Certification
14 24 (1.89%) DBS Check
15 22 (1.73%) CCNP
16 18 (1.42%) CCNA
17 13 (1.02%) JNCIA
18 6 (0.47%) (ISC)2 CCSP
Quality Assurance & Compliance
1 36 (2.84%) Accessibility
2 34 (2.68%) Data Quality
3 27 (2.13%) GDPR
4 26 (2.05%) GRC
5 25 (1.97%) ISO/IEC 12207
5 25 (1.97%) ISO/IEC 27001
6 20 (1.58%) NIST
7 10 (0.79%) HIPAA
7 10 (0.79%) NCSC
8 9 (0.71%) QA
9 5 (0.39%) PCI DSS
10 4 (0.32%) ISO 20022
10 4 (0.32%) SEPA
10 4 (0.32%) SLA
10 4 (0.32%) TARGET2
11 3 (0.24%) Def Stans
11 3 (0.24%) ISO/IEC 27002 (supersedes ISO/IEC 17799)
12 2 (0.16%) NIST 800
12 2 (0.16%) PMO
12 2 (0.16%) SOC 2
System Software
1 36 (2.84%) Docker
2 26 (2.05%) Firmware
3 10 (0.79%) VMware Infrastructure
4 8 (0.63%) Active Directory
4 8 (0.63%) Virtual Machines
5 5 (0.39%) Embedded Firmware
6 3 (0.24%) Hyper-V
6 3 (0.24%) VMware NSX
7 2 (0.16%) vSphere
8 1 (0.079%) VMware ESXi
Systems Management
1 60 (4.73%) Kubernetes
2 38 (2.99%) Terraform
3 21 (1.65%) Ansible
4 10 (0.79%) WMI
5 7 (0.55%) Endace
6 4 (0.32%) Single Sign-On
7 3 (0.24%) ZABBIX
8 2 (0.16%) FortiGate
8 2 (0.16%) vCenter Server
8 2 (0.16%) VxRail
9 1 (0.079%) Argo
9 1 (0.079%) Netcool
9 1 (0.079%) Netcool/OMNIbus
9 1 (0.079%) Prometheus
9 1 (0.079%) vRealize
Vendors
1 203 (16.00%) Microsoft
2 95 (7.49%) SAP
3 49 (3.86%) Google
4 47 (3.70%) Oracle
5 37 (2.92%) OpenText
6 36 (2.84%) Salesforce
7 33 (2.60%) Cisco
8 29 (2.29%) Juniper
9 25 (1.97%) VMware
10 24 (1.89%) Adobe
11 23 (1.81%) Palo Alto
12 21 (1.65%) Workday
13 20 (1.58%) Splunk
14 19 (1.50%) Databricks
15 18 (1.42%) Apple
15 18 (1.42%) BiZZdesign
16 12 (0.95%) Ariba
16 12 (0.95%) UiPath
17 11 (0.87%) Black Duck
18 9 (0.71%) Fortinet